Return to the Larsen B and Scar Inlet Ice Shelf
January 28, 2016Ted Scambos writes:
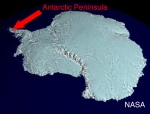
We have come back to this key area of Antarctica because it is on the ‘front line’ of how the continent is responding to warmer air and changing wind patterns. The Larsen B ice shelf, larger than Delaware in the 1990s, disintegrated in a matter of weeks in 2002. Between Jan 31 and March 17 of that year, 3250 km2 of ice 220 meters thick (over 700 feet) crumbled away after a very warm summer with extensive melting. However, one area of the Larsen B remained intact: a sheltered southern bay called Scar Inlet. In the past 14 years, this remnant shelf has changed dramatically, developing many new rifts and fractures. Moreover, since late 2011, the larger bay where the Larsen B once resided has been covered with a solid sheet of frozen ocean ice, called ‘fast ice’ because it is ‘fastened’ (frozen) to the coastline. We suspect that now this fast ice is supporting the weakened Scar Inlet shelf, and that the shelf is poised to break-up (at least partially) if the thin fast ice breaks away. This generally happens in late austral summer. Our mission is to set up a series of instruments for a few weeks to measure the structural state of both the fast ice and the Scar Inlet ice shelf plate.

The two color images are from NASA’s MODIS sensor, and record ‘before’ and ‘after’ conditions of the Larsen B ice shelf disintegration of 2002. The blue specks on the January 31st image are melt ponds from warm summer conditions. In the March 7 image, the blue areas are disintegrated ice blocks, often flipped on their side in the dynamic break-up event. The three images at the lower left record how the surface lakes disappeared over the weeks leading up to the break-up. At top right is a Landsat 7 image showing the melt ponds in more detail in a preceding summer. Image credit: T. Scambos, Scambos et al., 2003 AGU Antarctic Research Series v.79.
The images above are from satellite data taken during the break-up of the Larsen B in 2002. You can see why we are going at this time of year – this is exactly the part of the year, late summer, when these kinds of rapid break-ups can occur. The key factor is summer melting – in years when the shelf ice is covered with small blue melt ponds, there is a strong likelihood of disintegration. The lakes accelerate fracturing in the ice by filling cracks with water and breaking them open, a process called ‘hydrofracture’.
The remnant Scar Inlet ice shelf has remained intact but has evolved considerably in the years since 2002, developing new rifts, a more fractured margin, and deep troughs near the ice front. Below is a series of images showing how the ice has evolved, and the recent persistent fast ice.

Evolution of Scar Inlet Ice shelf from Jan 2004, Jan 2009, and Jan 2014. Images from MOA2004, MOA2009, and (in preparation) MOA2014. Red dots in 2014 image show locations of LARISSA-installed instrument assets (G, GPS; A, AMIGOS with high-resolution camera; A*, AMIGOS with GPS and webcam).
The research team has spent the past few years installing sensors on the ice shelf and on the rocks nearby. We’ve talked about these in the OTI blog before – the “AMIGOS” stations, having cameras, a GPS, and weather and ice-measurement instruments, and the continuous precision GPS stations, which also measure weather as well as ice or rock motion down to millimeter precision. The station on Cape Disappointment has been very useful (not disappointing at all!) for tracking how the edge of the ice shelf has crumbled over the past few years and mixed with the sea ice. A recent set of pictures – a panorama – is shown below.

Looking south from the Cape Disappointment AMIGOS station toward the Scar Inlet Shelf on January 2, 2016. The near foreground is the rocky cape where the AMIGOS system is installed; just beyond that is a part of the ice front that has fractured and retreated slightly over the past five years. In the distance is the remainder of the Scar Inlet ice shelf and the mountains of the Antarctic Peninsula. The entire ice surface in view is at risk of more rapid break-up if warm summer conditions occur.
A new satellite tool is now available for tracking how the Scar Inlet region evolves. Landsat 8, launched in February of 2013, provides 15m resolution images of the world’s land and ice cover, with color channels at 30 m resolution and thermal data as well. A false color image (using near-infrared light for red, red light for green, and green light for blue, to create an image that enhances the ability to detect melting) is shown from January 6. The fast ice has partially flooded due to warm conditions in late December and early January, and there are several cracks in the ice. A few ponds appear on the ice shelf and adjacent glaciers.
Our plan is to visit several of the stations, and install additional GPS stations (from the air – that should be interesting…) and then bring our additional cameras and other instruments to Cape Disappointment to record ~2 to 3 weeks of summer conditions on the fast ice and ice shelf in detail. Stay tuned…..

Landsat 8 image from January 6, 2016, showing summer conditions on the fast ice, glaciers, and ice shelf in the study area. .